MIT-missing-semester
Complete solutions for 2020 MIT Missing Semester course
Exercises 7: Debugging and Profiling
Debugging
-
Use
journalctlon Linux orlog showon macOS to get the super user accesses and commands in the last day. If there aren’t any you can execute some harmless commands such assudo lsand check again.$ log show --last 1d | grep sudo -
Do this hands on
pdbtutorial to familiarize yourself with the commands. For a more in depth tutorial read this. -
Install
shellcheckand try checking the following script. What is wrong with the code? Fix it. Install a linter plugin in your editor so you can get your warnings automatically.#!/bin/sh ## Example: a typical script with several problems for f in $(ls *.m3u) do grep -qi hq.*mp3 $f \ && echo -e 'Playlist $f contains a HQ file in mp3 format' doneI used Syntastic for my vim linter plugin using vim-plug plugin manager. It notes there are errors on line 3, line 5 and 6.
shellcheck playlist.shto check the error messages orvim playlist.sh(assuming Syntastic is installed) Fix the code accordingly:#!/bin/sh for f in *.m3u do grep -qi "hq.*mp3" "$f" \ && echo "Playlist $f contains a HQ file in mp3 format" done -
(Advanced) Read about reversible debugging and get a simple example working using
rrorRevPDB.
Profiling
-
Here are some sorting algorithm implementations. Use
cProfileandline_profilerto compare the runtime of insertion sort and quicksort. What is the bottleneck of each algorithm? Use thenmemory_profilerto check the memory consumption, why is insertion sort better? Check now the inplace version of quicksort. Challenge: Useperfto look at the cycle counts and cache hits and misses of each algorithm.- Using
cProfile:
$ python -m cProfile -s tottime sorts.py 1000

Ordered by: internal time

ncalls  tottime  percall  cumtime  percall filename:lineno(function)
 77977    0.049    0.000    0.110    0.000 random.py:174(randrange)
 77977    0.042    0.000    0.061    0.000 random.py:224(_randbelow)
34810/1000    0.034    0.000    0.036    0.000 sorts.py:30(quicksort_inplace)
33336/1000    0.033    0.000    0.050    0.000 sorts.py:21(quicksort)
  1000    0.029    0.000    0.029    0.000 sorts.py:10(insertionsort)
To install
line-profiler, cython must be first installed throughpip install cython. pip must also be installed. Don’t forget to editsorts.pywith@profiletags before line 10 and line 22 respectively.- Line profiling for
insertionsort:
$ kernprof -l -v sorts.py
Wrote profile results to sorts.py.lprof
Timer unit: 1e-06 s

Total time: 0.230475 s
File: sorts.py
Function: insertionsort at line 10

Line #      Hits         Time  Per Hit   % Time  Line Contents
==============================================================
   10                                           @profile
   11                                           def insertionsort(array):
   12
   13     24955       7908.0      0.3      3.4      for i in range(len(array)):
   14     23955       7131.0      0.3      3.1          j = i-1
   15     23955       7391.0      0.3      3.2          v = array[i]
   16    212548      77522.0      0.4     33.6          while j >= 0 and v < array[j]:
   17    188593      67494.0      0.4     29.3              array[j+1] = array[j]
   18    188593      54312.0      0.3     23.6              j -= 1
   19     23955       8442.0      0.4      3.7          array[j+1] = v
   20      1000        275.0      0.3      0.1      return array
The bottleneck (operation that takes the most time) seems to be the while loop according to the line profiling.
- Line profiling for
quicksort:
$ kernprof -l -v sorts.py
Wrote profile results to sorts.py.lprof
Timer unit: 1e-06 s

Total time: 0.142668 s
File: sorts.py
Function: quicksort at line 22

Line #      Hits         Time  Per Hit   % Time  Line Contents
==============================================================
   22                                           @profile
   23                                           def quicksort(array):
   24     33380      13365.0      0.4      9.4      if len(array) <= 1:
   25     17190       5021.0      0.3      3.5          return array
   26     16190       5506.0      0.3      3.9      pivot = array[0]
   27    123919      51637.0      0.4     36.2      left = [i for i in array[1:] if i < pivot]
   28    123919      49652.0      0.4     34.8      right = [i for i in array[1:] if i >= pivot]
   29     16190      17487.0      1.1     12.3      return quicksort(left) + [pivot] + quicksort(right)
The bottleneck (operation that takes the most time) seems to be the
leftandrightassignments according to the line profiling.It can be seen
quicksortis quicker thaninsertionsort.Use then
memory_profilerto check the memory consumption, why is insertion sort better? Don’t forget to editsorts.pywith@profiletags before line 10 and line 22 respectively.- Using
memory_profilerforinsertionsort:
$ python -m memory_profiler sorts.py Filename: sorts.py Line # Mem usage Increment Line Contents ================================================ 10 24.859 MiB 24.859 MiB @profile 11 def insertionsort(array): 12 13 24.859 MiB 0.000 MiB for i in range(len(array)): 14 24.859 MiB 0.000 MiB j = i-1 15 24.859 MiB 0.000 MiB v = array[i] 16 24.859 MiB 0.000 MiB while j >= 0 and v < array[j]: 17 24.859 MiB 0.000 MiB array[j+1] = array[j] 18 24.859 MiB 0.000 MiB j -= 1 19 24.859 MiB 0.000 MiB array[j+1] = v 20 24.859 MiB 0.000 MiB return array- Using
memory_profilerforquicksort:
$ python -m memory_profiler sorts.py
Filename: sorts.py

Line #    Mem usage    Increment   Line Contents
================================================
 20   24.836 MiB   24.801 MiB   @profile
 21                             def quicksort(array):
 22   24.836 MiB    0.000 MiB       if len(array) <= 1:
 23   24.836 MiB    0.000 MiB           return array
 24   24.836 MiB    0.000 MiB       pivot = array[0]
 25   24.836 MiB    0.000 MiB       left = [i for i in array[1:] if i < pivot]
 26   24.836 MiB    0.000 MiB       right = [i for i in array[1:] if i >= pivot]
 27   24.836 MiB    0.004 MiB       return quicksort(left) + [pivot] + quicksort(right)
Memory-wise,
insertionsortshould be strictly speaking, better thanquicksortas it does not allocate extra memory. In the last step ofquicksort, it concatenates which requires extra memory unlikeinsertionsortwhich changes its value ‘inplace’. (Albeit the difference is ignorable.)quicksort_inplaceis a function that improves on this redundant memory usage and performs its operations ‘inplace’, which can be examined usingmemory_profiler.- Using
memory_profilerforquicksort_inplace:
$ python -m memory_profiler sorts.py Filename: sorts.py Line # Mem usage Increment Line Contents ================================================ 28 24.859 MiB 24.801 MiB @profile 29 def quicksort_inplace(array, low=0, high=None): 30 24.859 MiB 0.004 MiB if len(array) <= 1: 31 24.859 MiB 0.000 MiB return array 32 24.859 MiB 0.004 MiB if high is None: 33 24.859 MiB 0.000 MiB high = len(array)-1 34 24.859 MiB 0.000 MiB if low >= high: 35 24.859 MiB 0.000 MiB return array 36 37 24.859 MiB 0.000 MiB pivot = array[high] 38 24.859 MiB 0.000 MiB j = low-1 39 24.859 MiB 0.004 MiB for i in range(low, high): 40 24.859 MiB 0.000 MiB if array[i] <= pivot: 41 24.859 MiB 0.000 MiB j += 1 42 24.859 MiB 0.000 MiB array[i], array[j] = array[j], array[i] 43 24.859 MiB 0.000 MiB array[high], array[j+1] = array[j+1], array[high] 44 24.859 MiB 0.000 MiB quicksort_inplace(array, low, j) 45 24.859 MiB 0.000 MiB quicksort_inplace(array, j+2, high) 46 24.859 MiB 0.000 MiB return array-
Challenge: Use
perfto look at the cycle counts and cache hits and misses of each algorithm.Skipped:
perfcommand only exists in Linux and not in macOS.
- Using
-
Here’s some (arguably convoluted) Python code for computing Fibonacci numbers using a function for each number.
#!/usr/bin/env python
def fib0(): return 0

def fib1(): return 1

s = """def fib{}(): return fib{}() + fib{}()"""

if __name__ == '__main__':

    for n in range(2, 10):
        exec(s.format(n, n-1, n-2))
    # from functools import lru_cache
    # for n in range(10):
    #     exec("fib{} = lru_cache(1)(fib{})".format(n, n))
    print(eval("fib9()"))
Put the code into a file and make it executable. Install
pycallgraph. Run the code as is withpycallgraph graphviz -- ./fib.pyand check thepycallgraph.pngfile. How many times isfib0called?. We can do better than that by memoizing the functions. Uncomment the commented lines and regenerate the images. How many times are we calling eachfibNfunction now?graphviz must be first installed to install
pycallgraph. After running the code above,pycallgraph.pngas below would be created in the current folder. According to the imagefib0is called 21 times.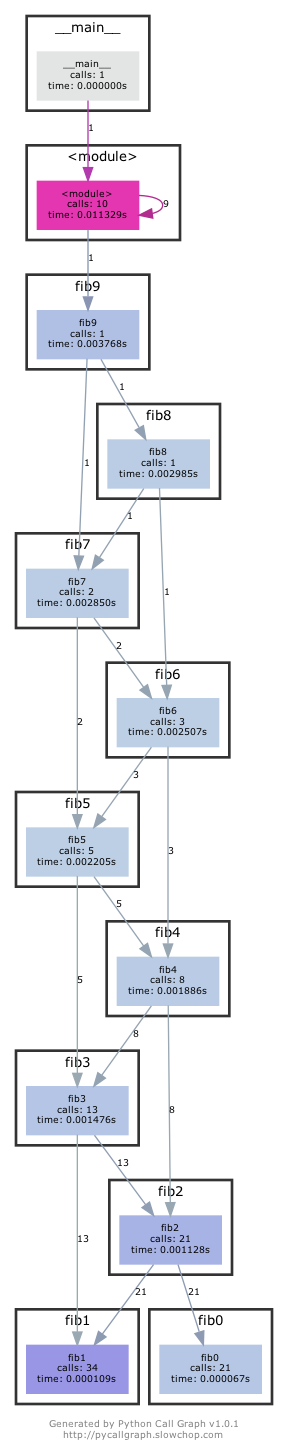
Uncomment the commented lines. Note that
lru_cachemay not be imported depending on the python version. Mine was python 2.7, so I imported from another module namedbackports.functools_lru_cache. More on this issue. The revised code is as below.#!/usr/bin/env python def fib0(): return 0 def fib1(): return 1 s = """def fib{}(): return fib{}() + fib{}()""" if __name__ == "__main__": for n in range(2, 10): exec(s.format(n, n - 1, n - 2)) from backports.functools_lru_cache import lru_cache for n in range(10): exec("fib{} = lru_cache(1)(fib{})".format(n, n)) print(eval("fib9()"))The corresponding new
pycallgraph.pngshould show eachfibNcalled only one time. -
A common issue is that a port you want to listen on is already taken by another process. Let’s learn how to discover that process pid. First execute
python -m http.server 4444to start a minimal web server listening on port4444. On a separate terminal runlsof | grep LISTENto print all listening processes and ports. Find that process pid and terminate it by runningkill <PID>.When
lsofis run, there will be a log that starts with Python, and the next column denotes its PID.$ lsof | grep LISTEN Python 15190 username 4u IPv4 0xebd5e4a0507078b7 0t0 TCP *:krb524 (LISTEN) $ kill 15190After the
killcommand, it can be seen that the python server running on the other terminal has been successfully terminated.$ python -m http.server 4444 Serving HTTP on 0.0.0.0 port 4444 (http://0.0.0.0:4444/) ... [1] 15190 terminated /usr/bin/python3 -m http.server 4444 -
Limiting processes resources can be another handy tool in your toolbox. Try running
stress -c 3and visualize the CPU consumption withhtop. Now, executetaskset --cpu-list 0,2 stress -c 3and visualize it. Isstresstaking three CPUs? Why not? Readman taskset. Challenge: achieve the same usingcgroups. Try limiting the memory consumption ofstress -m.Skipped. (
stressandcgroupsonly exists in Linux and not in macOS) -
(Advanced) The command
curl ipinfo.ioperforms a HTTP request an fetches information about your public IP. Open Wireshark and try to sniff the request and reply packets thatcurlsent and received. (Hint: Use thehttpfilter to just watch HTTP packets).